
Continuous asset assurance
Continuous Condition Evidence
Bring machine-condition evidence into the same governed record as inspections, corrective work and asset decisions without making IoT mandatory for every tenant or asset.
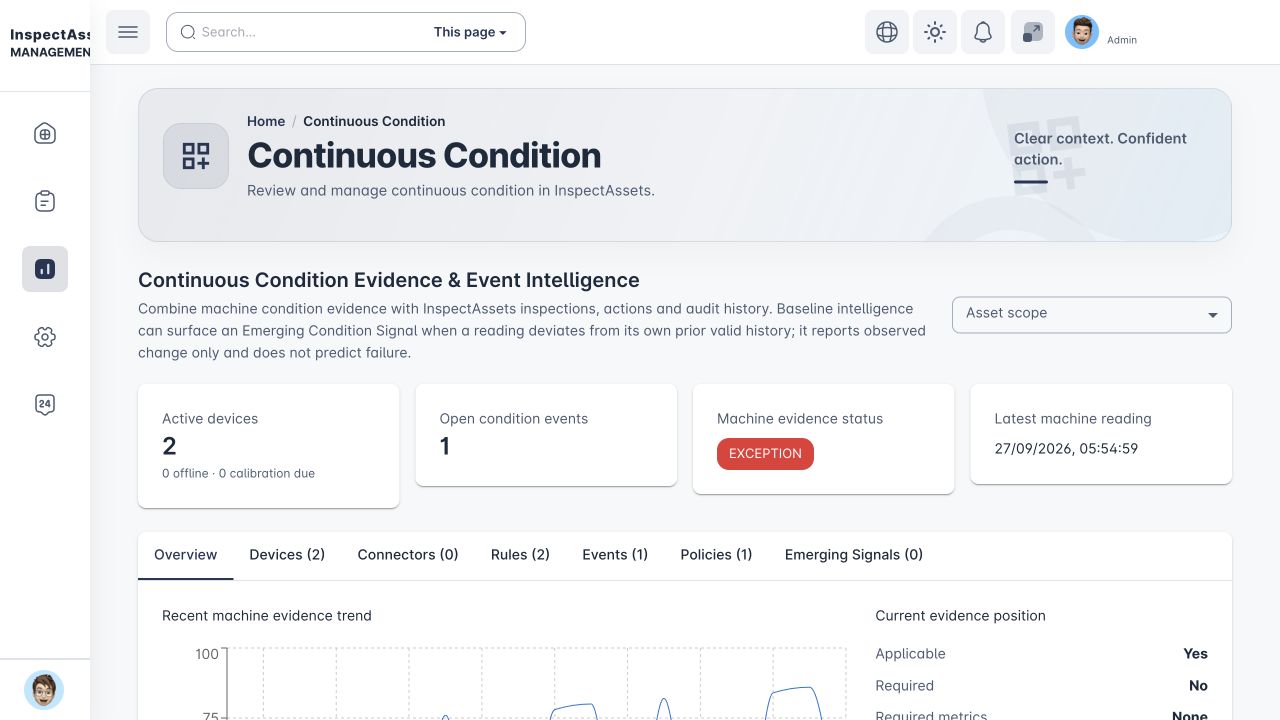
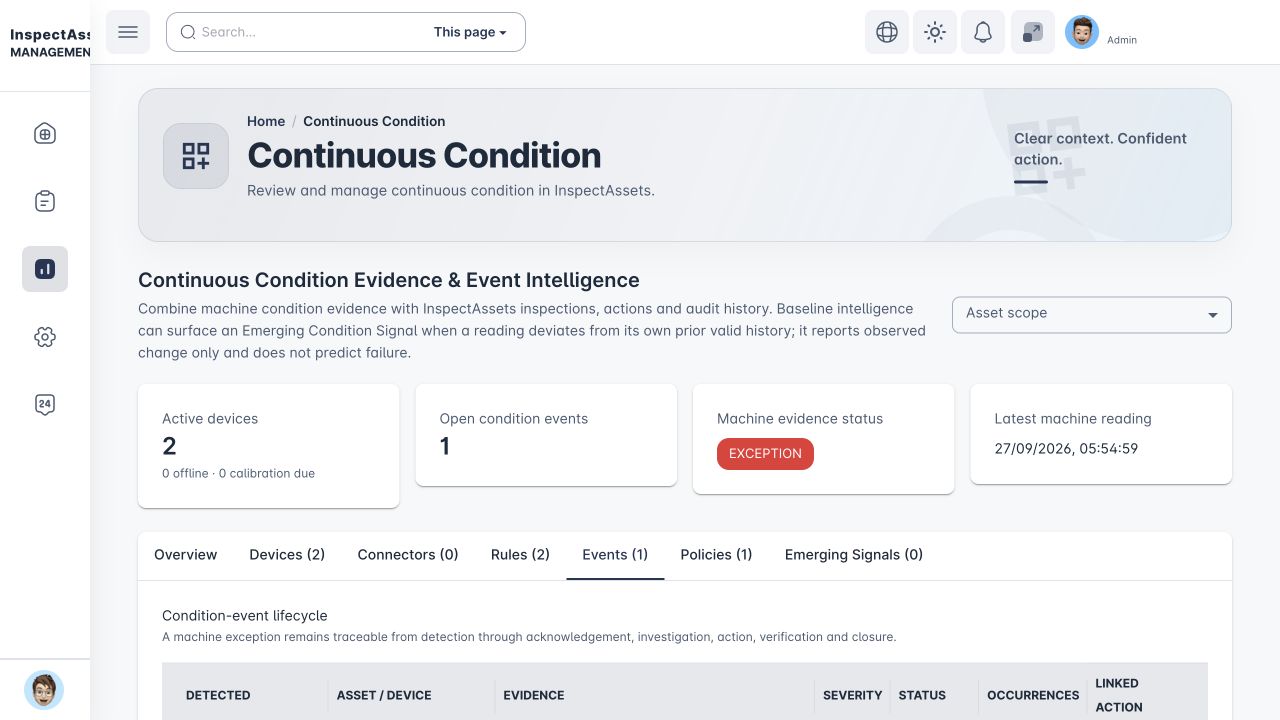
Inspection evidence + machine evidence + operational action
InspectAssets can receive condition readings from connected devices, gateways or approved external sources between formal inspections. It does not manufacture or control the hardware. The platform registers the evidence source, receives and validates telemetry, evaluates configured rules, creates traceable condition events and can trigger the appropriate operational follow-up.
Machine evidence is optional by default
If a tenant, site, asset type or asset has no applicable machine-evidence requirement, the absence of IoT data is treated as Not Applicable, not Missing. Machine evidence affects Decision Readiness as a required input only when an authorised policy explicitly makes it required.
Who can use this area
The feature must be enabled for the tenant. Access is then controlled by dedicated permissions rather than by role name alone.
| Permission | What it allows |
|---|---|
view_condition_evidence | View the continuous-condition workspace, readings, devices, rules, events and resolved evidence position. |
manage_condition_devices | Register direct devices/sources, update or disable them, and rotate direct device credentials. |
view_condition_connectors | View configured transport connectors, their transport/provenance boundary, current health, heartbeat, delivery and failure history. |
manage_condition_connectors | Create/update connectors, rotate connector credentials, refresh health and retry failed connector deliveries. |
manage_condition_rules | Create and manage thresholds, persistence, hysteresis, cooldown, severity and action policy. |
manage_condition_events | Acknowledge, investigate, verify, resolve, close or dismiss condition events and manage linked condition actions. |
manage_condition_policies | Define where machine evidence is optional or required and how fresh required evidence must be. |
Built-in tenant roles may receive different combinations of these permissions, and custom roles can be configured. Always rely on the permissions shown to your account rather than assuming access from a role title.
Viewing does not grant device-management access
A user with view_condition_evidence can review connected sources, readings and evidence state. The interface remains read-only for device setup unless the same account also has manage_condition_devices. Connecting a source, enabling/disabling it or rotating its credential requires that exact permission.
Supported machine-condition metrics
The current canonical metrics are:
The device record can classify the evidence source as direct REST/API, webhook/event sender, MQTT-connected bridge, sensor gateway or OEM/vendor cloud. This classification records where the evidence originates. It is provenance, not an active network connection by itself.
Transport connector versus source provenance
These are deliberately separate
Source provenance answers “where did this evidence originate?” (for example MQTT-connected gateway or OEM cloud). A transport connector answers “how is InspectAssets actively receiving and monitoring this source?” Selecting MQTT, gateway or OEM cloud as provenance does not create an MQTT subscription or OEM integration.
The currently supported configured connector type is Generic JSON HTTPS Push. The external gateway/source sends JSON to an InspectAssets connector endpoint using a connector-specific secret. InspectAssets maps that source JSON into the same canonical telemetry envelope already used by direct device ingestion. Rules, condition events, evidence history and governed follow-up therefore remain on one telemetry path.
The existing Direct condition-device ingress remains supported. It issues an HTTPS device ingestion endpoint and one-time device token. Use it when the external sender can already emit the canonical InspectAssets reading shape and connector-level mapping/health history is not required.
Create a Generic JSON HTTPS Push connector
- Open Continuous Condition and select Connectors. This tab is available to users with
view_condition_connectorsormanage_condition_connectors, alongside workspace access. - If your account has
manage_condition_connectors, select Create connector. - Choose the asset, connector name, canonical metric and unit.
- Select the Source provenance. This records the source origin independently of the connector transport.
- Set the expected heartbeat and retry policy. The supported connector transport is shown as HTTPS JSON push.
- Map the external JSON fields using dotted paths. At minimum, confirm the value and observation/source-message fields that your source supplies.
- Create the connector and immediately copy the one-time connector secret, HTTPS ingest path and heartbeat path.
The connector secret is shown once
Store it in the gateway/source secret store. InspectAssets stores a hash of the connector credential, not the raw connector secret. If the secret is lost or suspected to be exposed, use Rotate secret and replace the credential in the external sender.
Send the first connector reading
Authenticate source requests with X-Connector-Secret: <secret>. The default mapping accepts a canonical-style JSON body:
{
  "value": 37.5,
  "unit": "C",
  "observed_at": "<ISO-8601 timestamp>",
  "source_message_id": "source-message-001",
  "sequence_no": 1,
  "quality_state": "valid",
  "gateway_id": "gateway-01",
  "source": "Plant gateway"
}
If the source payload is nested, map dotted paths such as reading.value, reading.unit, reading.at and reading.id. Mapping changes do not require a new connector.
Connector health, retries and recovery
The connector registry shows the transport, source provenance, health, last heartbeat, last successful ingest, failure count and most recent error. Health states are:
| Status | Meaning |
|---|---|
| Pending | Configured but no successful connector traffic has established healthy state yet. |
| Healthy | Recent heartbeat/ingest activity is within the configured heartbeat window and there is no active failure. |
| Degraded | A delivery failed but remains eligible for retry. |
| Stale | The expected heartbeat window has been missed long enough to require attention. |
| Offline | The source has missed the offline heartbeat threshold. |
| Error | A delivery exhausted the configured retry policy or another terminal connector error is recorded. |
| Disabled | The connector is intentionally disabled and cannot accept new connector traffic. |
Select History to review deliveries and health events. A failed delivery records its error and retry state. Users with manage_condition_connectors can retry failed/dead-letter deliveries after correcting the source or mapping. Successful recovery returns the connector to Healthy while preserving the earlier failure/offline history.
The connector supports a dedicated heartbeat path. Periodic heartbeat POSTs and successful connector readings refresh connectivity state. Refresh health evaluates configured heartbeat windows so stale/offline status becomes visible even when no new source message arrives.
Direct condition-device ingress
This direct-device connection is always anchored to an existing InspectAssets asset. The physical asset does not authenticate directly to InspectAssets; a sensor, gateway or external condition-data integration is registered against that asset.
Choose the existing asset that owns the machine evidence.
Describe the metric and external source that will send the readings.
Store the issued HTTPS path and one-time device token in the external sender.
Send a numeric reading from the gateway or integration.
Use the connection check and last-reading status to confirm that InspectAssets received evidence.
Start from the asset record
- Open Asset Management, select the asset and open its Passport.
- In Condition sources, users with
manage_condition_devicescan select Connect condition source. InspectAssets opens Continuous Condition with the asset already selected. View-only users see the same evidence card but do not see the connection action. - Enter a clear source/device name and select the metric. Add the unit and source type where appropriate.
- Optionally add vendor, model, serial number, external/component references, device-level thresholds and expected heartbeat.
- Select Create connection.
Or start from Continuous Condition
- Open Continuous Condition and select the Devices tab.
- Select Connect condition source if your account has
manage_condition_devices. - Choose the correct asset, then complete the source/device details and create the connection.
Configure the external sender
After registration, InspectAssets shows the connection details. Complete these steps before closing the credential dialog:
- Copy the issued HTTPS ingestion endpoint.
- Copy and securely store the one-time device token.
- Configure the external sender to authenticate each reading using either
X-Device-Token: <token>orAuthorization: Bearer <token>. - Send the first numeric reading. Include
observed_atwhere available and use a stablesource_message_idif the source can retry delivery. - Select Check connection. A source remains Waiting for first reading until InspectAssets has accepted its first reading; after that the registry shows the latest reading/connection state.
{
  "value": 72.5,
  "unit": "C",
  "observed_at": "<ISO-8601 timestamp>",
  "source_message_id": "<unique-source-message-id>"
}
The registered device credential is already bound to the tenant and asset. The sender does not submit an arbitrary asset ID with each reading; InspectAssets resolves the asset from the registered device.
The device token is shown only when created or rotated
The credential is bound to the registered device, tenant and asset context. Do not paste it into ordinary notes or screenshots. If the credential is lost or suspected to be exposed, use Rotate token; update the sending integration with the new token before relying on further telemetry.
Devices can also be disabled without deleting their historical evidence. A disabled device cannot submit new readings.
Telemetry ingestion and evidence quality
Each registered device receives a dedicated ingestion path. The sending source authenticates with the device credential and sends a numeric reading. A canonical reading can also carry an observation timestamp, unit, source message ID, sequence number, quality state and provenance context.
InspectAssets validates incoming readings before they are accepted. Invalid values or unacceptable timestamps are rejected and recorded as ingestion failures. A source message ID can be supplied so a repeated delivery of the same source message is treated as a duplicate rather than creating a second reading/event.
Use source message IDs where the upstream system can retry
Gateways, webhooks and OEM integrations commonly retry deliveries. A stable upstream message ID gives InspectAssets a deterministic way to de-duplicate those retries while keeping the original accepted reading.
Condition rules: threshold, persistence, hysteresis and cooldown
Rules decide when a reading becomes an operational condition event. A rule can apply to one asset and optionally one device, and must define at least a minimum or maximum threshold.
| Control | Purpose |
|---|---|
| Minimum / maximum threshold | Defines the condition boundary for the selected metric. |
| Hysteresis | Adds a buffer around the threshold so small movements near the boundary do not repeatedly flip between normal and exception. |
| Minimum occurrences | Specifies how many qualifying readings are required before the exception becomes actionable. |
| Persistence window | Defines the time window in which the required qualifying occurrences must be observed. |
| Cooldown | Suppresses creation of a new event for the same direction/rule shortly after a previous event has been closed. |
| Severity | Sets the operational severity of the rule: medium, high or critical. |
| Action policy | Controls what InspectAssets creates when the exception becomes actionable: evidence only (none), an inspection-review action, or a work order. |
Until persistence is satisfied, an out-of-band reading can remain a watch signal rather than immediately generating duplicate work.
Condition-event lifecycle
When a rule becomes actionable, InspectAssets creates a traceable condition event and links it to the source reading, device and asset. Repeated qualifying readings update the existing open event and occurrence count instead of opening parallel events for the same active exception.
The exception has been detected and requires operational attention.
An authorised user has taken ownership of reviewing the event.
The event is being assessed against the asset, inspection and maintenance context.
The condition and follow-up have been checked or otherwise resolved.
The event lifecycle is complete. Dismissal should be used only where the evidence supports that decision.
The supported event statuses are open, acknowledged, under_investigation, action_required, verified, resolved, closed and dismissed. Status changes are tenant-scoped and recorded in the audit history.
Automatic operational work
The rule's action policy determines whether a machine exception remains evidence-only or creates operational work:
- None: keep the condition event as evidence without automatically creating follow-up work.
- Inspection review: create a linked condition action prompting the team to review the machine evidence and decide whether inspection or corrective work is required.
- Work order: create a predictive work order linked back to the condition event and source machine reading, with priority and due timing derived from severity.
Automated creation does not remove human judgement. Review the evidence, asset criticality and operating context before treating a machine exception as a confirmed defect or closing the resulting work.
Machine-evidence policies
Policies answer a governance question: for this scope, should machine evidence be considered optional or required? A policy can apply to the whole tenant, a site, an asset type or one asset. More specific policy scopes take precedence over broader scopes: asset, then asset type, then site, then tenant.
A policy can specify required metrics and a freshness window. When machine evidence is required, InspectAssets can identify missing required devices/metrics or stale evidence. When it is optional, the lack of machine evidence does not reduce Decision Readiness.
| Situation | Evidence position |
|---|---|
| No policy and no registered device | Not Applicable — the asset/tenant is not penalised for not using IoT. |
| Optional evidence with devices/readings | Available machine evidence is shown and can inform the asset record. |
| Required evidence but no required device/metric | Missing. |
| Required evidence older than the configured freshness window | Stale Required. |
| Current evidence with an open high/critical condition event | Exception and the event remains visible for action. |
| Current evidence with no active exception | Current. |
Heartbeat, offline state and calibration
If an expected heartbeat interval is configured, InspectAssets compares the last-seen time with that expectation and surfaces devices that appear offline. A grace period is applied so small transport delays do not immediately create a false offline indication. Devices with an overdue calibration date are also surfaced for attention.
An offline device is a signal about the evidence source, not proof that the physical asset has failed. Investigate connectivity, gateway/source health and the asset context separately.
Evidence Passport, Decision Readiness and risk integration
Continuous condition evidence does not live in a separate silo. Where available and authorised, the asset record can carry a machine-evidence position into the Asset Evidence Passport alongside inspection history, coverage, confidence, limitations and lifecycle evidence.
Decision Readiness keeps the optional/required distinction intact. Optional machine evidence does not reduce the readiness score. When a policy explicitly requires machine evidence, missing/stale required evidence or open high/critical events can lower the readiness position so management can see that the evidence base is not yet strong enough for the intended decision.
Open high/critical machine-condition events can also contribute to risk-based inspection scheduling and urgency. Use the Risk Register, asset view and linked evidence together before committing resources.
Connector troubleshooting
- 401 Invalid or disabled connector: confirm the connector ID and current connector secret; rotate the secret if needed and update the sender.
- Degraded/Error: open History, read the failed delivery reason, correct the JSON mapping/source data, then retry the delivery.
- Stale/Offline: confirm the external source still sends heartbeat or readings inside the expected interval, then use Refresh health after restoring traffic.
- No reading after a successful HTTP call: verify the mapped value is numeric, the timestamp is valid and the source message ID is stable across retries.
- Source says MQTT/OEM but transport says HTTPS: this can be correct. Source provenance describes origin; the configured connector describes the active InspectAssets transport.
Baseline and rate-of-change intelligence
Evidence-derived, not predictive
InspectAssets can compare a new valid reading with the same device's prior valid telemetry. This creates an asset-device baseline and rate-of-change view. It does not predict equipment failure, probability of failure or remaining useful life.
The baseline uses prior valid readings from the same tenant, device and unit. The baseline band is the wider of three standard deviations or 5% of the absolute mean (with a small numerical floor). At least 8 prior valid readings are required before a baseline can be calculated. If there is not enough history, the UI displays Insufficient evidence and does not invent a normal range.
The baseline displays the evidence window, sample count, mean and baseline band. Rate of change is shown as a per-hour slope and a simple evidence classification: stable, increasing, decreasing or noisy.
Emerging Condition Signal
An Emerging Condition Signal can be recorded when a valid reading moves outside the calculated asset-device baseline band while remaining below/above the configured absolute threshold boundary. This distinction matters:
- Absolute threshold event: governed by the existing Condition Rules / event lifecycle.
- Emerging Condition Signal: evidence that the device has moved away from its own historical baseline without claiming a predicted failure.
Open the Emerging signals tab to review the observed value, baseline mean/band, baseline sample count, rate-of-change classification, calculation version, evidence-reading references and the generated rationale.
On the Devices tab, use View baseline to inspect the latest baseline evaluation even when no signal exists. The dialog explicitly shows an insufficient-data state when there is not enough prior history.
Evidence trace and calculation version
Every stored signal records the source asset/device/current reading, the prior reading references used for the baseline, the evidence time window and the calculation version. The initial calculation version is wp09-eci-v1. This lets reviewers reproduce what the system observed at the time the signal was created.
Claim boundary
Use terms such as Emerging Condition Signal, observed deviation or anomaly. Do not describe a baseline deviation as “predicted failure”, “failure probability” or “remaining useful life” unless a separately validated predictive model is introduced and governed in a future release.
How to review an Emerging Condition Signal
- Open Continuous Condition → Emerging signals.
- Confirm the asset, device, metric, current value and unit.
- Compare the current value with the displayed baseline band and baseline sample count.
- Review the rate-of-change classification and per-hour slope.
- Read the rationale and confirm it describes observed evidence rather than predicting a future failure.
- Use the calculation version and evidence-reference count for audit/review. Use View baseline on the device if you need the latest evaluation state.
Recommended operating practice
- Register only evidence sources that can be reliably tied to the correct asset.
- Store one-time device credentials in an approved secret store and rotate them when exposure is suspected.
- Use source message IDs for integrations that retry deliveries.
- Use persistence and hysteresis to reduce noisy alerts rather than setting thresholds that create repeated false work.
- Use machine-evidence policies only where the business, reliability or compliance case genuinely requires the evidence.
- Investigate offline devices as evidence-source issues; do not automatically classify the asset itself as failed.
- Close or dismiss condition events only after the linked evidence and operational follow-up support that decision.